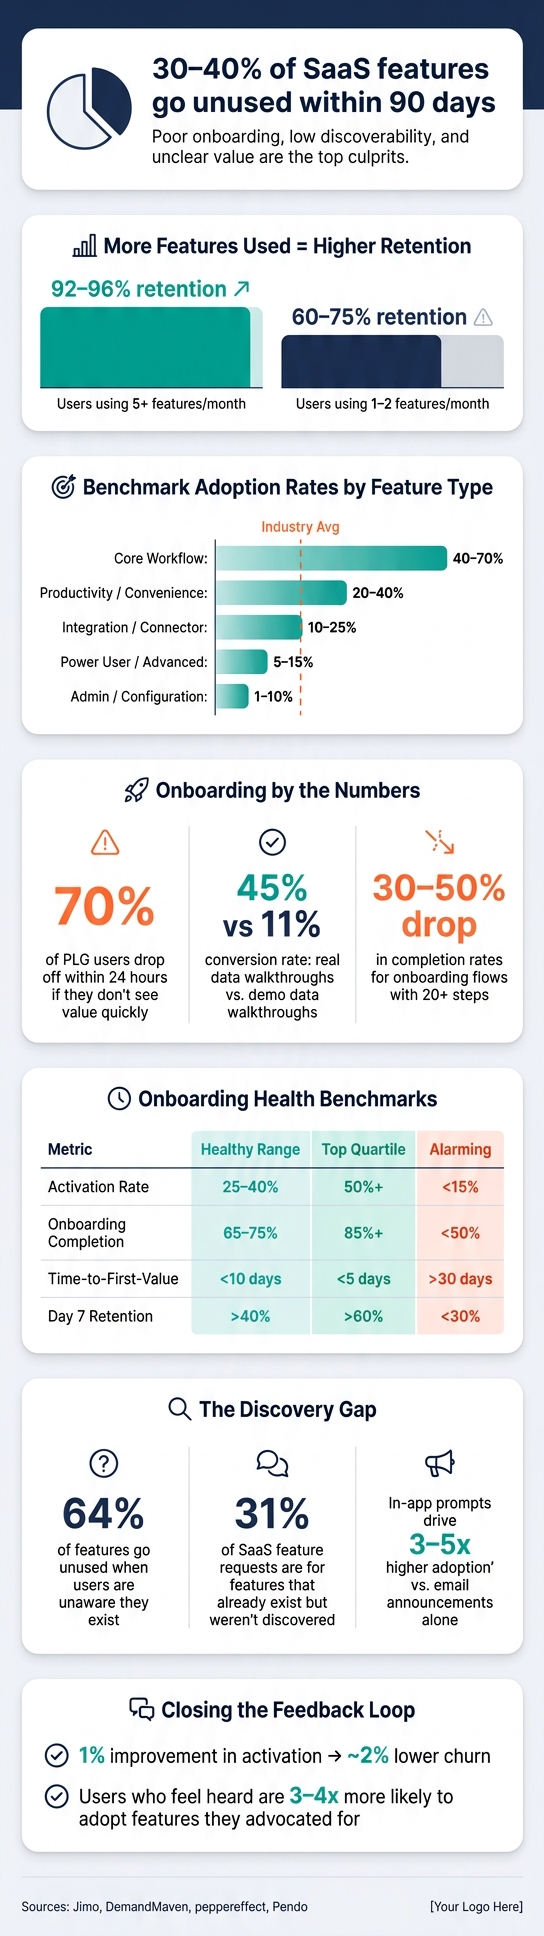
Getting users to adopt new features is often harder than building them. In fact, 30–40% of SaaS features go unused within 90 days. Why does this happen? Poor onboarding, low discoverability, and unclear value are common culprits.
Here’s what you need to know to improve feature adoption:
- Adoption drives retention: SaaS accounts using 5+ features/month retain at 92–96%, while 1–2 feature users drop to 60–75%.
- Track key metrics: Feature adoption rate, time to value (TTV), and stickiness (DAU/MAU) reveal usage patterns.
- Fix onboarding: Short, contextual guidance (3–5 steps) boosts activation and reduces churn.
- Improve discoverability: Timely in-app prompts outperform static banners by 3–5x.
- Use feedback loops: Combine user data with surveys to identify and address friction points.
Adoption isn’t just about usage – it’s about making features part of the user’s workflow. This guide explains how SaaS founders can measure, refine, and communicate features to maximize retention and revenue.
SaaS Feature Adoption Metrics: Key Benchmarks & Stats
Key Metrics SaaS Founders Track for Feature Adoption
Defining the Core Metrics
Tracking the right metrics is essential for understanding how well a feature is being adopted. When it comes to SaaS, founders often focus on a few key numbers that, together, provide a clear picture of whether a feature is resonating with users.
One of the most telling metrics is the feature adoption rate, which calculates the percentage of eligible users who engage with a feature over a specific time frame. The formula is simple: (unique users who used the feature ÷ total eligible users) × 100. On average, the core feature adoption rate in the industry stands at 24.5%, with a median of 16.5%. However, these rates vary based on the type of feature being measured:
| Feature Type | Healthy 90-Day Adoption Rate |
|---|---|
| Core Workflow | 40–70% |
| Productivity / Convenience | 20–40% |
| Integration / Connector | 10–25% |
| Power User / Advanced | 5–15% |
| Admin / Configuration | 1–10% |
These adoption rates not only measure usage but also highlight potential barriers users might face. Metrics like time to value (TTV) – how long it takes users to achieve a meaningful outcome – and activation rate, which tracks the percentage of users reaching the "aha moment", are critical for assessing onboarding success. Another key metric, feature stickiness, calculated as (DAU ÷ MAU) for a specific feature, provides insight into how often users return to engage with it.
Reading Adoption Signals
Metrics are more than just numbers – they tell a story about where users struggle. Founders who dig into these signals can identify specific problems, rather than just observing trends.
"A feature with strong activation and low return usage has a value problem… A feature with low activation has a discoverability problem." – Fahmi Dani, Product Designer, Jimo
This insight is crucial. For example, low activation rates often point to discoverability or onboarding challenges – users simply aren’t finding the feature. On the other hand, high activation but low retention suggests the feature isn’t delivering enough value to keep users coming back. If a feature has high exposure but low adoption, the issue might lie in unclear benefits that fail to motivate action.
Each of these patterns requires a tailored solution. By tracking these metrics together, founders can pinpoint friction points and make targeted improvements. These insights also feed directly into iterative development processes, setting the stage for broader discussions on feedback loops and how they enhance feature adoption. Up next, we’ll dive into how refining onboarding can resolve many of these friction points.
sbb-itb-772afe6
Product analytics 101- feature adoption and retention metrics
How Onboarding Affects Feature Adoption
Onboarding is the critical moment where feature adoption either takes off or stalls. Shockingly, about 70% of users who sign up for a product-led growth (PLG) product drop off within the first 24 hours if they don’t quickly see value. That initial experience is key to engaging users with the core features of a product.
"Feature adoption planning should start at the onboarding design stage, not after the launch post-mortem." – Fahmi Dani, Product Designer, Jimo
Cutting Friction in Onboarding
These days, many companies are shifting away from static onboarding tours toward behavior-triggered guidance. Instead of forcing users through a rigid series of tooltips on day one, the most effective onboarding uses contextual prompts tied to actual user actions. For example, a developer analytics platform generating $22M ARR increased adoption of its premium API monitoring feature from 19% to 42% in nine months. How? By showing a tooltip only after users viewed error logs three or more times in one session. This approach ensures guidance appears when it’s most relevant, rather than following a predefined schedule.
Other strategies, like offering smart defaults and pre-built templates, can help reduce decision fatigue and speed up the time it takes for users to experience value. Keeping onboarding flows short – ideally 3–5 essential steps – is another game-changer. Long flows with more than 20 steps see completion rates drop by 30–50%. Additionally, walkthroughs that incorporate a user’s real data (instead of placeholder content) consistently perform better, converting at 45% compared to just 11% for versions using demo data.
The next step is measuring the impact of these improvements to identify exactly where users are dropping off and where adjustments are needed.
Measuring Onboarding Effectiveness
To know if onboarding is working, you need to track more than just login numbers. The most telling metrics include activation rate, onboarding completion rate, Time-to-First-Value (TTFV), and checklist drop-off rate. Together, these metrics show not only how far users progress but also pinpoint where they get stuck.
| Metric | Healthy Range | Top Quartile | Alarming |
|---|---|---|---|
| Activation Rate | 25–40% | 50%+ | <15% |
| Onboarding Completion Rate | 65–75% | 85%+ | <50% |
| Time-to-First-Value (TTFV) | <10 days | <5 days | >30 days |
| Day 7 Retention | >40% | >60% | <30% |
One useful diagnostic? Review 20–30 session replays before blaming low adoption on product flaws. Often, the real culprit is something simple, like a confusing UI element, that could be fixed with a well-placed in-app guide – no engineering required. The ultimate goal is what Asia Orangio, Founder of DemandMaven, describes perfectly:
"Activation is the journey through which a new user understands or experiences the value of the product. And the goal is for that to happen as fast as humanly possible."
Here’s why this matters: every 1% improvement in activation leads to roughly 2% lower churn. That’s why onboarding is one of the highest-impact areas for SaaS founders to focus on. The connection between onboarding and retention is clear, emphasizing the need for constant refinement to create a seamless user experience. These insights pave the way for strategies that encourage deeper feature adoption.
Getting Users to Discover and Use New Features
Features often go unused simply because users don’t know they exist. In fact, 64% of features are left untouched when users remain unaware of them. Even more surprising, 31% of feature requests in SaaS companies are for functionality that’s already available but hasn’t been discovered. This lack of awareness translates to wasted engineering efforts – something that could be avoided with better communication strategies.
"Most ‘we have an adoption problem’ diagnoses are actually ‘we have a discovery problem.’" – Peter Vogel, Founder, peppereffect
Once onboarding is optimized, the next challenge is ensuring users discover and adopt new features.
Using Contextual Prompts and Callouts
Static dashboard banners often fall short. Prompts delivered at the right moment are far more effective, driving 3–5x higher feature adoption compared to email announcements alone.
Take this example: In 2024, a construction project management SaaS company ($12M ARR) replaced static dashboard banners with a contextual tooltip. This tooltip only appeared when users accessed the legacy scheduling view. From there, a 4-step walkthrough – using real data – introduced their AI scheduling module. The result? Feature adoption jumped from 14% to 38% in six months, translating to $780K in retained revenue.
However, it’s important not to overwhelm users. Limiting active in-app campaigns to 2–3 features at a time reduces the risk of guidance fatigue. Static banners, for instance, might see 8–12% engagement in the first week, but that drops to just 2–3% by week three as users grow immune to notifications.
By combining timely prompts with thoughtful in-product announcements, companies can further enhance user engagement.
Communicating Feature Releases Inside the Product
The way you introduce a new feature can be just as important as the feature itself. Context-aware launches, such as in-app chats tailored to user behavior, can achieve over 30% adoption within 30 days – far surpassing traditional announcement modals.
Segmentation is crucial here. A one-size-fits-all announcement risks alienating users through notification fatigue. Instead, targeting specific user cohorts works better. For instance, advanced features can be introduced to power users, while newer users are guided through core functionalities first.
Here’s a real-world example: An enterprise HR platform ($45M ARR) used a role-based cascading model to roll out a new feature. First, HR Directors received email alerts and walkthroughs. Once they activated the feature, Workforce Planners were prompted with contextual guidance. This approach boosted adoption from 12% to 34% over 12 months. By progressively disclosing features as users demonstrated readiness, the platform aligned its feature communication with user needs – just like effective onboarding does.
Another powerful tactic? Notify users who previously requested or voted for a feature on launch day. This creates a pre-qualified audience, with adoption rates 5–10x higher than non-voting active users.
Measuring Feature Usage and User Behavior Accurately
Clicks might show interest, but repeated use tells you if a feature has truly been adopted. If you measure the wrong metrics, you risk making poor decisions. That’s why getting the right approach to measuring adoption – starting with accurate denominator definitions – is so important.
Calculating Adoption Rates by Eligible Users
One common mistake is dividing feature users by the entire user base. Imagine a feature that’s exclusive to Pro plan users – if you include free-tier users in your calculations, it will unfairly lower the adoption rate, making a successful feature seem like a flop.
Here’s the correct formula: (Feature MAUs / Total Eligible User Logins in Period) × 100. The key is to include only those users who can actually access the feature – based on their plan, role, or permissions. This is especially crucial in B2B SaaS, where admins and end users often interact with features in entirely different ways.
"A benchmark number without those two decisions [adoption criterion and segmented denominator] in place is not a target. It is a distraction." – Fahmi Dani, Product Designer, Jimo
But raw adoption rates only tell part of the story. To truly understand a feature’s performance, you need to examine how usage evolves over time.
Tracking Behavior Patterns Over Time
Judging a feature solely by its launch-week numbers is a mistake. Launch spikes are often driven by curiosity or novelty, but sustained use over 30, 60, or 90 days reveals whether a feature delivers lasting value.
A helpful framework for tracking this is the Exposed → Activated → Used → Used Again funnel. Each stage provides critical insights: low activation might point to discoverability issues, while high activation paired with low 30-day retention suggests a value gap. And these two problems require entirely different solutions.
"A feature with strong initial activation but low feature retention has a value problem… Running another announcement campaign will not move this number." – Fahmi Dani, Product Designer, Jimo
This long-term perspective also helps identify critical usage thresholds – specific actions or usage patterns that correlate with better retention. For instance, if users who create three or more reports in their first two weeks are far less likely to churn, that becomes your real adoption target – not just a vague "used the feature" checkbox.
The numbers back this up: B2B SaaS accounts using 5 or more features per month retain at rates of 92%–96%, while those using only 1 or 2 features retain at just 60%–75%. This highlights the importance of tracking how deeply users engage with your product, not just how many features they touch.
Using Feedback Loops to Improve Feature Adoption
Feedback loops are a powerful tool for understanding how users interact with your product and identifying areas for improvement. While metrics and onboarding strategies help track user behavior, feedback loops dig deeper into the why behind user drop-offs, offering valuable insights for refining your product.
Gathering Actionable User Feedback
To get meaningful feedback, use a mix of passive signals – like support tickets and app store reviews – and active methods, such as in-app surveys and user interviews. Passive feedback highlights issues that frustrate users, while active methods help uncover points of confusion. Together, they provide a fuller picture, even capturing insights from users who might otherwise stay silent.
For example, tagging support tickets by feature and friction type can reveal problem areas. If one feature generates an unusually high number of tickets, that’s a red flag you should address before it impacts retention. Consider this: for every user who complains, 26 others may leave without saying a word.
When it comes to surveys, how you deliver them matters. In-app surveys typically see response rates between 15% and 35%, far outperforming external links, which only get 2% to 8%. Timing is also critical – triggering surveys after a user’s second interaction with a feature ensures you’re capturing informed feedback.
"A single request is an anecdote. Ten requests are a pattern. Fifty requests are a priority." – Mahir Can Yuksel, Founder & CEO, FeedSense
This combination of methods helps identify friction points and sets the stage for targeted improvements.
Iterating on Features Based on Data
Feedback becomes impactful when it leads to actionable changes. Start by segmenting feedback by user group: if power users struggle with a feature, it’s likely a value issue; if new users drop off, discoverability might be the problem.
Take the billing SaaS industry as an example. In 2023, one platform’s "Automatic Dunning Emails" feature had just 9% adoption. Feedback revealed users were hesitant to write email copy from scratch. The solution? The team added pre-written templates and a UI showing projected revenue recovery. By Q1 2024, adoption jumped to 28%, with users recovering a median of $1,850 per month. This wasn’t a massive overhaul – it was a targeted tweak based on user feedback.
"Pairing feature-level behavioral data with feature-level feedback is what separates a PM who is iterating on evidence from one who is iterating on assumptions." – Fahmi Dani, Product Designer, Jimo
Finally, always close the loop by notifying users when their feedback leads to changes. Users who feel heard are 3–4 times more likely to adopt the features they’ve advocated for.
Lessons from SaaS Founders on Long-Term Feature Adoption
Viewing Adoption as an Ongoing Journey
For SaaS founders, adoption isn’t a one-time event – it’s a continuous process. Launching a feature is just the starting point; the real challenge lies in encouraging users to engage with it repeatedly and independently. Successful founders see adoption as a multi-stage funnel: users progress from initial exposure to activation, then to regular engagement, and finally to habitual use. That final stage is where a feature becomes an integral part of a user’s workflow.
This idea ties back to earlier discussions about onboarding and personalized feature communication. By treating adoption as an ongoing process, teams ensure their product remains relevant over time.
"Activation tells you a user experienced the feature once. Adoption tells you they came back to it on their own, without a tooltip pointing them there, because it has become part of how they work." – Fahmi Dani, Product Designer, Jimo
The difference between teams that sustain adoption and those that only see short-term spikes lies in their focus on long-term behavioral trends. Leading product teams regularly evaluate feature performance – often quarterly – and retire the least-used 5% of features. This not only keeps the product streamlined but also frees up engineering resources for features users truly value.
Instead of relying on frequent, generic outreach, successful teams prioritize timely, context-driven interactions. For example, HubSpot saw sustained adoption of its Sidekick email tracking tool by introducing in-app reminders only when users were actively composing emails. This contextual approach outperformed traditional time-based announcements.
By making adoption an ongoing effort, teams can strike a balance between tracking metrics and delivering a better experience.
Balancing Metrics with User Experience
While tracking adoption metrics is important, leaning too heavily on numbers can hurt user satisfaction. Metrics like DAU/MAU (daily or monthly active users) can be inflated by tactics like intrusive notifications, which may drive logins but don’t necessarily create meaningful engagement. The goal should always be authentic interaction, not artificially boosted activity.
Todd Olson, Founder and CEO of Pendo, highlighted this balance when he made a deliberate choice not to include manual "track events" in Pendo’s analytics tools. Instead, he opted for auto-tracking to create a smoother, less burdensome experience for users.
"What you refuse to build becomes your differentiator." – Todd Olson, Founder and CEO, Pendo
This balanced approach is supported by data: B2B SaaS customers who use five or more features per month have retention rates between 92% and 96%, compared to just 60% to 75% for those using only one or two features. However, pushing users to adopt more features too aggressively can backfire. A better strategy is progressive disclosure, where advanced features are introduced gradually as users become more comfortable. Building trust first paves the way for deeper engagement over time.
Conclusion: Building a Culture of Continuous Improvement
Here’s the key insight from SaaS founders who excel at feature adoption: launching a feature is just the starting line. The real challenge lies in what happens next – tracking user behavior, gathering insights, and adapting based on what users actually do, not what you expected them to do.
Metrics are essential for identifying problems. For example, a drop in activation rates might point to discoverability issues, while stagnant repeat usage could signal a gap in perceived value. But numbers alone don’t tell the full story. To understand why these issues occur, you need qualitative feedback. By combining behavioral data with tools like micro-surveys or session replays, teams can move beyond guesswork. This approach uncovers not just the problems, but their root causes, paving the way for meaningful changes that are grounded in evidence.
One effective strategy is shifting from calendar-based to behavior-based user engagement. Instead of relying on scheduled emails, teams that focus on timely, in-context interventions see better results. For instance, in-app methods like tooltips or product tours – delivered precisely when a feature becomes relevant – can boost adoption rates by 3–5 times compared to email announcements alone.
This blend of data-driven insights and precise timing doesn’t just enhance features; it also helps teams identify which features to cut. Regularly auditing your product and retiring underused features (such as the bottom 5% by usage) isn’t a sign of failure – it’s about reallocating resources where they’ll make the biggest impact. As Peter Vogel, Founder of peppereffect, aptly said: "Adoption is the highest-ROI lever in the post-sale operating system." But that only holds true when the features being adopted genuinely address user needs.
This iterative process – measuring performance, gathering feedback, and acting on it – underscores a simple truth: continuous improvement is the foundation of long-term success in the SaaS world.
FAQs
What counts as “adoption” vs. just a click?
Adoption happens when users regularly and effectively incorporate a feature into their daily routines, proving it delivers consistent value. In contrast, a click represents a single interaction or brief engagement that doesn’t guarantee lasting use or meaningful impact.
How do I pick the right “eligible users” for adoption rate?
To determine adoption criteria, focus on behaviors that demonstrate the feature has become a natural part of users’ workflows. Make sure to include only those users who have access to the feature and exclude individuals without access or those in unrelated segments. This way, your adoption rate will represent a clear and accurate picture of relevant usage.
What should I try first if activation is high but repeat use is low?
If users are engaging with a feature initially but not coming back, it’s time to rethink how the feature provides lasting value. One approach is to reduce the time it takes for users to see results – this can make the feature’s benefits more immediately apparent. Additionally, providing contextual guidance during their first interactions can help users understand how to get the most out of it. These tweaks can make the feature more appealing and encourage repeat usage.