Net Promoter Score (NPS) is a simple metric that measures customer loyalty by asking, "How likely are you to recommend this product on a scale of 0–10?" SaaS companies use NPS to identify at-risk customers, improve retention, and guide product development. Here’s what you need to know:
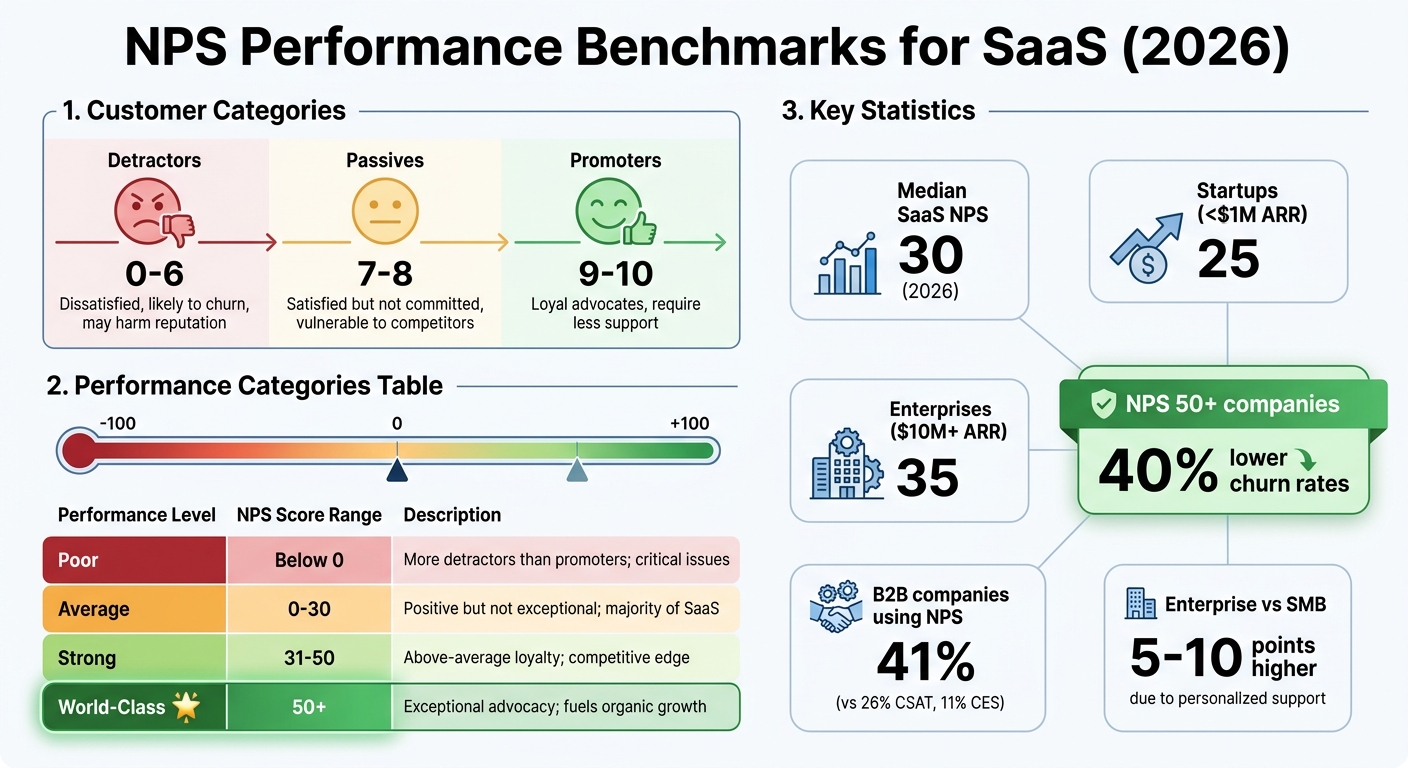
- How NPS works: Scores are divided into Promoters (9–10), Passives (7–8), and Detractors (0–6). Your NPS is calculated by subtracting the percentage of Detractors from Promoters.
- Why it matters: SaaS companies with NPS above 50 experience 40% lower churn rates. The median NPS for SaaS in 2026 is 30.
- Key uses:
- Spotting customers likely to leave and addressing their concerns early.
- Using feedback to refine products and fix issues.
- Leveraging Promoters for upselling and advocacy programs.
NPS isn’t just a number – it’s a tool to reduce churn, boost growth, and improve customer satisfaction. Below, we explore how SaaS companies can maximize its potential.
What Is NPS? The Score That Measures Customer Love
sbb-itb-772afe6
What NPS Means for SaaS Companies
NPS Score Ranges and Performance Benchmarks for SaaS Companies
What NPS Measures in SaaS
Net Promoter Score (NPS) is a tool that evaluates the overall relationship customers have with your SaaS product, rather than focusing on their satisfaction with individual features or interactions. While metrics like CSAT measure specific experiences and CES assesses how easy it is to use a product, NPS goes a step further – it gauges whether customers would recommend your product to others.
For SaaS businesses with recurring revenue, NPS offers valuable financial insights. High scores (9–10) often indicate opportunities for growth and expansion, while low scores (0–6) can signal an increased risk of customer churn.
The NPS framework breaks customers into three groups:
- Promoters: These are loyal advocates who not only refer others but also require less support.
- Passives: They’re satisfied but not fully committed, making them vulnerable to competitor offerings.
- Detractors: These customers are dissatisfied, more likely to leave, and may harm your brand’s reputation.
This categorization provides actionable insights and helps SaaS companies understand their standing within the industry.
NPS Benchmarks for SaaS
As of 2026, the median NPS for SaaS companies is 30. This figure serves as a reference point for comparison. Startups with annual recurring revenue (ARR) under $1 million typically score around 25, while larger enterprises with $10 million or more in ARR average a score of 35.
Here’s a breakdown to help you interpret your NPS results:
| Performance Category | NPS Score Range | What It Means |
|---|---|---|
| Poor | Below 0 | Indicates more detractors than promoters; signals critical issues. |
| Average | 0–30 | Positive but not exceptional; reflects the majority of SaaS companies. |
| Strong | 31–50 | Shows above-average loyalty; provides a competitive edge. |
| World-Class | 50+ | Represents exceptional advocacy that fuels organic growth. |
SaaS companies with NPS scores above 50 tend to experience 40% lower churn rates. This demonstrates a clear connection between strong customer sentiment and better business outcomes. Among B2B companies, 41% rely on NPS as their primary metric, compared to 26% for CSAT and 11% for CES. Notably, enterprise-focused SaaS products often score 5–10 points higher than those targeting SMBs, thanks to more personalized support and dedicated customer success teams.
Tracking Customer Health and Retention
Using NPS to Find At-Risk Customers
NPS detractors – customers who score between 0 and 6 – are often the ones most likely to churn. While detractors rarely voice their concerns directly, NPS surveys can help uncover these hidden risks. However, traditional NPS surveys typically identify dissatisfaction only after it’s already surfaced. Predictive health scoring takes a more proactive approach, flagging at-risk customers 28–35 days before they would respond negatively to surveys. This method uses behavioral signals like login frequency, feature adoption, and the tone of support ticket interactions, combined with NPS data.
"Reactive NPS surveys tell you AFTER customers are unhappy. Predictive health scores identify at-risk customers 28-35 days before they would respond negatively to surveys." – Max Beech, Head of Content, Athenic
For example, SuccessFlow created an 8-signal health score system that weighted product usage (40%), support sentiment (25%), engagement (20%), and commercial signals (15%). This system acted as an early warning tool, cutting churn from 6.8% to 2.9% and doubling their customer save rate.
Health scores below 60 have been shown to predict NPS detractors with 87% accuracy. By identifying these warning signs early, companies can act quickly. Many SaaS businesses use tiered response strategies: Customer Success Managers (CSMs) personally call customers with "Critical" scores (below 40), send personalized emails to those with "At-Risk" scores (40–59), and use automated outreach for "Fair" scores (60–74).
Spotting at-risk customers is just the beginning. To retain them effectively, further segmentation is key.
Segmentation for Better Retention
Once you’ve identified at-risk customers, segmenting them can help fine-tune your retention efforts. Breaking customers into groups based on contract value, stakeholder role, or lifecycle stage allows for more precise responses. For instance, high-value enterprise customers should be prioritized, with some companies setting service-level agreements (SLAs) to ensure critical detractor scores are addressed within 1–2 hours.
Surveying multiple contacts within an account also improves accuracy, offering a 40% clearer picture of account health compared to relying on a single champion. This is because executive sponsors often score 5–10 points higher than end users, which can skew results. Additionally, lifecycle-based surveys can pinpoint specific issues. For example, detractors at day 30 might indicate onboarding challenges, while detractors at day 330 could signal feature gaps or competition.
Cross-referencing NPS scores with product usage data provides even deeper insights. If detractors have low feature adoption, the issue might be related to training or product complexity. On the other hand, if active users still give low scores, the root cause could be bugs or missing features.
Automation can make segmentation more actionable. By connecting your NPS tool to platforms like Slack or your CRM, you can instantly notify the right CSM when a high-risk score is flagged. Automated programs have been shown to recover 35–55% of detractors, compared to just 11–14% for manual efforts.
Using NPS for Product Development
Turning NPS Feedback into Product Insights
The follow-up question in NPS surveys – "Why did you give us this score?" – provides a treasure trove of insights. Beyond just numbers, it uncovers product pain points, overlooked features, and usability issues that might not be immediately obvious.
For example, passives (scores of 7–8) often highlight missing features that, if addressed, could turn them into enthusiastic promoters. On the other hand, detractors expose more urgent issues like critical bugs, poor user experiences, or even deeper product-market fit concerns that need immediate resolution.
Take Typeform as an example. In March 2023, under the leadership of VP of Customer Success David Apple, the company launched a "Customer Voice" dashboard. By tagging and categorizing NPS feedback into themes like "new feature requests" or "problems with multiple fields", they turned qualitative insights into quantifiable data. This approach helped them prioritize their product roadmap based on real user challenges instead of assumptions.
"NPS is a really powerful tool. With just two questions, you get qualitative as well as quantitative feedback. We use NPS data to design our product map…"
Tagging open-ended responses into categories like "UI issues", "integration requests", or "performance problems" helps identify recurring patterns. These patterns provide product managers with actionable data to justify development decisions.
Another example comes from Kommunicate. Their NPS feedback revealed that many users were requesting features that already existed. Instead of creating new functionality, they introduced guided checklists to help users discover and adopt these features more effectively.
This kind of qualitative feedback forms the foundation for more strategic product development. When paired with analytical tools, the insights become even more impactful.
Combining NPS with Analytics and Sentiment Analysis
While qualitative feedback is essential, combining it with product analytics provides deeper insights into user behavior. For instance, linking NPS responses to tools like PostHog or Google Analytics 4 can reveal which features promoters love and which ones detractors avoid.
In August 2025, involve.me used AI to analyze over 12,000 open-ended NPS responses. Through automated sentiment analysis, they identified integration opportunities and pinpointed functional bugs that were causing dissatisfaction. These insights were directly funneled into their development process.
A legal practice management platform offers another compelling example. By automating 90-day post-onboarding NPS surveys, they identified 32 detractors per quarter – up from just 6 with manual surveys. Using this feedback to guide product improvements, they reduced annual churn from 11% to 7.2%, protecting $480,000 in annual revenue within just four months.
Connecting NPS data to financial metrics like Monthly Recurring Revenue (MRR) can also help prioritize development efforts. For instance, mapping detractor scores to revenue risk highlights which features are critical to high-value customers. This makes it easier to justify the costs of specific development projects. Additionally, integrating NPS tools with platforms like Zendesk can show whether new features are reducing support tickets – or unintentionally creating new issues.
Tracking NPS at different stages of the customer lifecycle provides even more valuable insights. For example, comparing scores at 1 month versus 6 months post-signup can reveal how user needs evolve over time. A drop in scores at the 6-month mark might indicate that users are outgrowing basic features and require more advanced functionality. By acting on these insights, companies can reduce churn and build stronger customer loyalty.
Finding Upselling and Advocacy Opportunities
Targeting Promoters for Upsells
Promoters – those customers who score 9 or 10 on NPS surveys – are your prime candidates for upselling. These users already see the value in your product, making them more likely to consider upgrades, add-ons, or higher-tier plans.
Statistically, promoters are 4 times more likely to make repeat purchases than other customer segments. They also tend to spend 20–30% more over their lifetime compared to passive customers.
Combining NPS scores with product usage data can uncover even more upselling opportunities. For instance, if a promoter consistently hits plan limits – like storage caps or user seat quotas – it’s a clear sign they might benefit from an upgrade. Account managers can use these insights during regular check-ins to suggest upgrades that align with the customer’s needs.
NPS can also act as a predictor of growth, often signaling revenue opportunities 6–12 months before they materialize. By integrating NPS data into your CRM (like HubSpot or Salesforce), your sales team can easily identify high-value promoters and prioritize outreach.
Another great strategy is inviting promoters to test new features in beta. This not only gives you valuable feedback but also makes customers feel like valued partners in your product’s evolution. This sense of collaboration often leads to natural upsell opportunities.
But upselling is just one part of the equation. Promoters are also key to building strong advocacy programs.
Creating Advocacy Programs
Once you’ve achieved upsell success, the next step is turning promoters into advocates. Advocacy programs leverage their loyalty to drive organic growth while reducing acquisition costs. Referrals from advocates convert 3–5 times better than other channels, and customers acquired through referrals tend to have a 16% higher lifetime value.
Interestingly, only 11% of SaaS marketers actively ask for referrals, despite their potential. Considering that 84% of people trust recommendations from friends or colleagues over other forms of marketing, this is a huge missed opportunity.
You can automate advocacy efforts by reaching out to promoters right after they submit an NPS score. For example, a custom thank-you page could include a direct link to leave reviews on platforms like G2 or Capterra. Automated email campaigns can also encourage promoters to join referral programs or share their success stories.
When creating referral programs, consider using double-sided incentives, which reward both the referrer and the new customer. Research shows that 65% of referrers prefer sharing rewards with the people they bring in. This could include account credits, extended trial periods, or discounts on future renewals.
Not every promoter will want to engage in the same way, so offering tiered advocacy options is a smart move. Some might prefer private 1:1 references for enterprise deals, while others are open to public case studies or speaking at events. Providing a range of options – from simple testimonials to in-depth video success stories – ensures that customers can participate at a level they’re comfortable with. To maintain engagement, track how often specific advocates are used and rotate them. For example, limiting reference requests to once per quarter can increase long-term participation by 35%.
This approach not only boosts revenue but also reinforces a customer-first strategy.
"Promoters from NPS surveys are way more than just numbers on your spreadsheet. Treat them like VIPs and it will impact the bottom line in a big way."
- Jessica Malnik, Writer and Community Builder
How to Run NPS Surveys in SaaS
Running effective NPS (Net Promoter Score) surveys can turn raw customer feedback into actionable insights for improving retention and driving product development. The key lies in choosing the right survey type, timing it well, and keeping it simple. There are two main types of NPS surveys – relationship and transactional – and knowing when to use each is critical.
The ideal survey format is straightforward: start with a 0-10 rating question, followed by an open-ended query like, "What is the primary reason for your score?". Keep surveys short – 1 to 3 questions – to encourage participation. Surveys with fewer questions see response rates soar to over 83%, while those with 15 or more questions drop to just 41.94%.
In-app surveys tend to outperform email, with a 21.71% response rate compared to email’s 12–15%. However, email still has its advantages for reaching users who aren’t regularly active, like executives or dormant accounts.
Once feedback is collected, closing the loop within 48 hours is crucial. Companies that respond quickly see a 6-point NPS boost and generate three times more promoters in subsequent surveys. Despite this, only 26% of B2B companies follow up with all their customers, missing easy opportunities to improve satisfaction.
Now, let’s break down the difference between relationship and transactional NPS surveys.
Relationship vs. Transactional NPS
Relationship NPS (rNPS) measures overall customer sentiment toward your brand. These surveys are sent periodically – typically quarterly or semi-annually – and are not tied to any specific interaction. They provide a broad picture of customer loyalty over time.
Transactional NPS (tNPS) focuses on specific interactions, like completing onboarding, resolving a support issue, or using a new feature. Timing is critical for tNPS – send surveys immediately or within 24–72 hours of the event while the experience is fresh. Automated event-triggered surveys see a 41.8% response rate, compared to just 14.2% for batch surveys. The difference lies in timing, not design or incentives.
Between 2018 and 2019, Superhuman CEO Rahul Vohra used a specialized survey alongside NPS to identify customers with high expectations. By focusing on feedback from the "very disappointed" group, the team boosted their product-market fit score from 33% to 58% in just three quarters.
A smart approach is to segment your results by user role. For example, executive buyers tend to give a median NPS of 46, while end users score around 36. If you only survey decision-makers, you might miss insights about the actual product experience.
Once you’ve chosen the survey type, the next step is to nail the timing.
When and How Often to Survey
Timing your first survey is a big deal. Send the initial NPS survey 7–30 days after signup, ideally when the customer reaches their "first value" moment – when they’ve experienced enough of your product to form an opinion.
For relationship NPS, a quarterly cadence works best in B2B SaaS. It keeps you updated without overwhelming customers. To avoid survey fatigue, limit surveys to one per user every 30 to 90 days. Products with daily engagement can sustain a 45-day interval, while less frequently used products should stick to 90 days.
Transactional NPS should be tied to specific milestones, such as 48–72 hours after onboarding, 24 hours after resolving a support ticket, or 3–5 days after launching a major feature. You can also use surveys to re-engage inactive users – send one if someone hasn’t logged in for 14 days.
For email surveys, the best results come when sent Tuesday through Thursday, between 9:00 AM and 11:00 AM local time. Embedding the first NPS question directly in the email (rather than linking to an external form) can significantly improve response rates.
In 2022, Atlassian’s product teams adopted a process where they addressed top detractor themes from NPS feedback in their quarterly roadmaps. This approach led to a 15-point NPS increase across their product suite over two years.
One last tip: route feedback to the right team. For example, send billing-related complaints to payment recovery teams instead of product teams. Since 20–40% of SaaS churn is involuntary, addressing these issues quickly can improve customer satisfaction faster than a product update ever could.
Conclusion
NPS is a powerful tool for driving retention, guiding product improvements, and fueling growth. Automated, event-triggered workflows have proven to significantly improve detractor recovery rates, jumping from 12% to over 40%. This shift plays a critical role in protecting revenue and reducing churn.
Consider this: SaaS companies with NPS scores above 50 see churn rates drop by 40%. Automated programs also outperform manual efforts, achieving detractor recovery rates of 35–55%, compared to just 11–14% for manual approaches. Real-world examples highlight these impacts. Between 2024 and 2026, a legal practice management platform introduced automated NPS workflows, boosting its score from 28 to 41 in just 180 days. This change saved $304,000 in annual revenue by curbing churn. Similarly, a marketing analytics platform with $22M ARR raised its NPS from 34 to 50, while increasing free-to-paid conversion rates from 2.8% to 4.6%. The result? A $3.9M annual revenue lift.
To replicate these results, focus on actionable steps. Close the feedback loop within 48 hours – faster for enterprise accounts. Segment responses based on user roles and lifecycle stages, and ensure feedback reaches the right teams. Keep in mind that only 1 in 26 unhappy customers will voice their complaints before leaving. NPS gives you the opportunity to hear from the silent majority. Use in-app surveys for active users, emails for dormant ones, and design workflows tailored to specific scores – like instant Slack alerts for scores of 0–3 or upgrade offers for scores of 9–10. Integrating these actions with your CRM ensures a seamless process.
Adopt a quarterly NPS schedule and pair it with transactional surveys after key moments, such as onboarding, support interactions, or feature launches. Focus on trends over time rather than fixating on a single score. As Jeff Immelt, CEO of General Electric, wisely noted:
"NPS creates a view of customer loyalty. The absolute score is less important than the trend. We learn from both promoters and detractors. Most importantly, we have been able to associate NPS improvement with growth".
The numbers speak for themselves: acquiring a new customer costs 4 to 5 times more than retaining an existing one. A well-executed NPS program can more than pay for itself if you act on the insights it delivers. Set clear SLAs, automate processes, and ensure every score leads to meaningful action. NPS isn’t just a metric – it’s a strategy for growth.
FAQs
What’s a good NPS for my SaaS at our stage?
A Net Promoter Score (NPS) of 50 or higher is generally considered strong for SaaS businesses. Many leading SaaS companies hit this benchmark, showcasing high levels of customer satisfaction and loyalty.
How do I turn detractor scores into churn prevention actions?
To reduce churn, take proactive steps when dealing with detractor scores. Start by reaching out to detractors to learn about their concerns and address them directly. Integrate NPS feedback into your CRM to segment detractors and set up automated workflows tailored to their needs. Consistently review open-ended feedback to spot recurring issues and fix them quickly, ensuring customer concerns are resolved and loyalty is preserved.
How can NPS feedback directly shape the product roadmap?
Net Promoter Score (NPS) feedback plays a crucial role in guiding the product roadmap. It highlights areas where customers are dissatisfied, giving teams clear direction on what needs attention. With this insight, they can prioritize updates and focus on features that not only improve satisfaction but also help reduce churn. By responding directly to customer needs, SaaS companies can strengthen both engagement and retention.